 Nice Guy University
 DemoStoke
 Antisyphon
 Bars of Sand
 Riptyde
 DemoStoke Fleet Ops
 TimeFraim
 12 Step Meetings
 Find Your Flow State
 Who’s In Charge?
 Adam Chiappone
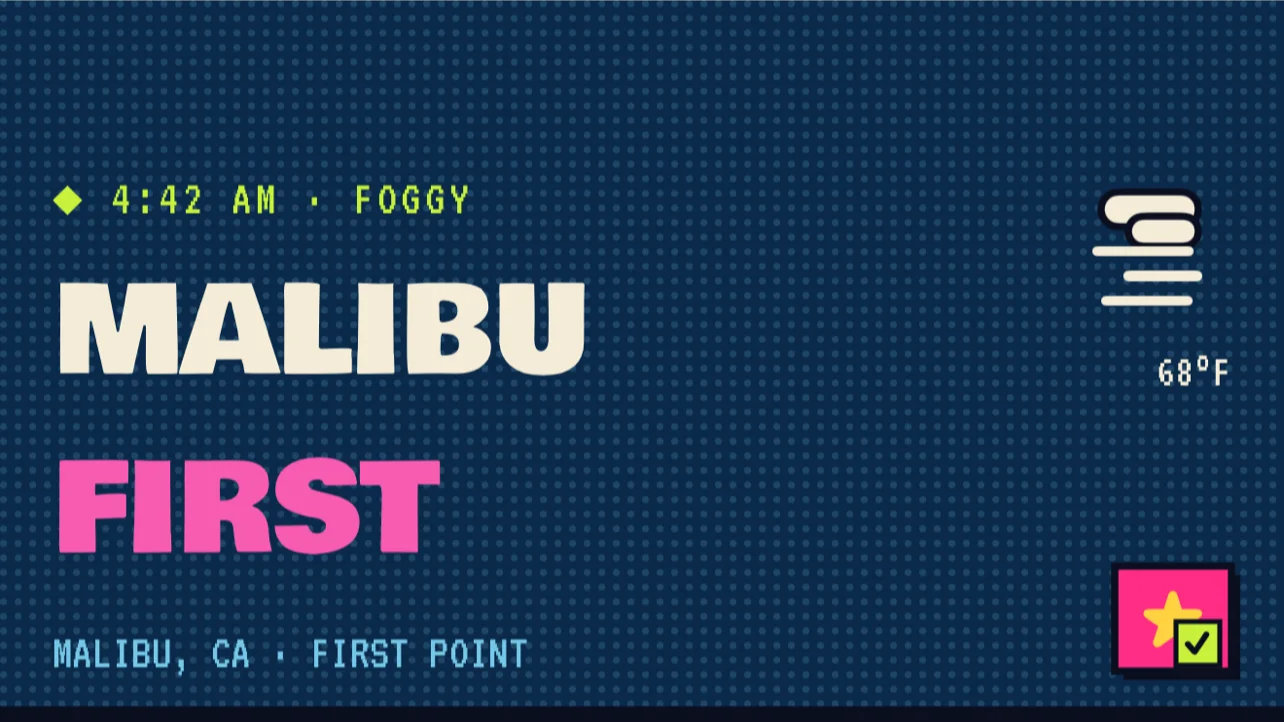
One number, no excuses
Surf forecasts bury the answer under swell charts and jargon, so I built Riptyde around a single RAD-O-METER™ score for every break. The ten-day outlook, wind, and next tide sit right underneath, and the go/no-go call takes seconds.
Show the work behind the score
A single number is only useful if people trust it, so I designed the RAD breakdown to show the math. Wave height, period, wind, and swell direction each get a rating, a plain-language note, and their share of the total, so the score never feels like a black box.
Scope the lineup
The Lineup ranks every spot by score. I added quick filters for favorites, custom spots, and break type, and put distance and a color-coded rating on every card, so surfers can pick where to paddle out at a glance.
Beach cams, one tap away
Forecasts are still forecasts, so I put public beach cams beside the score for a look at the real thing. Each cam refreshes on demand and links straight to the source feed.
Every break on the map
I mapped surf spots along the entire West Coast, from British Columbia down to San Diego, so surfers can see what’s around them and jump straight to the closest break.
Rewind ten days
I added Throwback mode to replay the last ten days of scores and conditions. Surfers can compare what they rode with what the forecast said and get a feel for how the score plays out in the water.
Charts, tide, and AI summaries
For surfers who want the details, I tucked hourly surf-quality charts, wind and tide cards, a board recommendation, and an AI summary below the score, where they don’t crowd the first screen.
Sessions, streaks, and crew
I built the Profile to track sessions, waves, hours, and best scores, then added Crew so friends can share sessions and secret spots. Streaks keep the habit going.